Complete GitHub Actions Overview
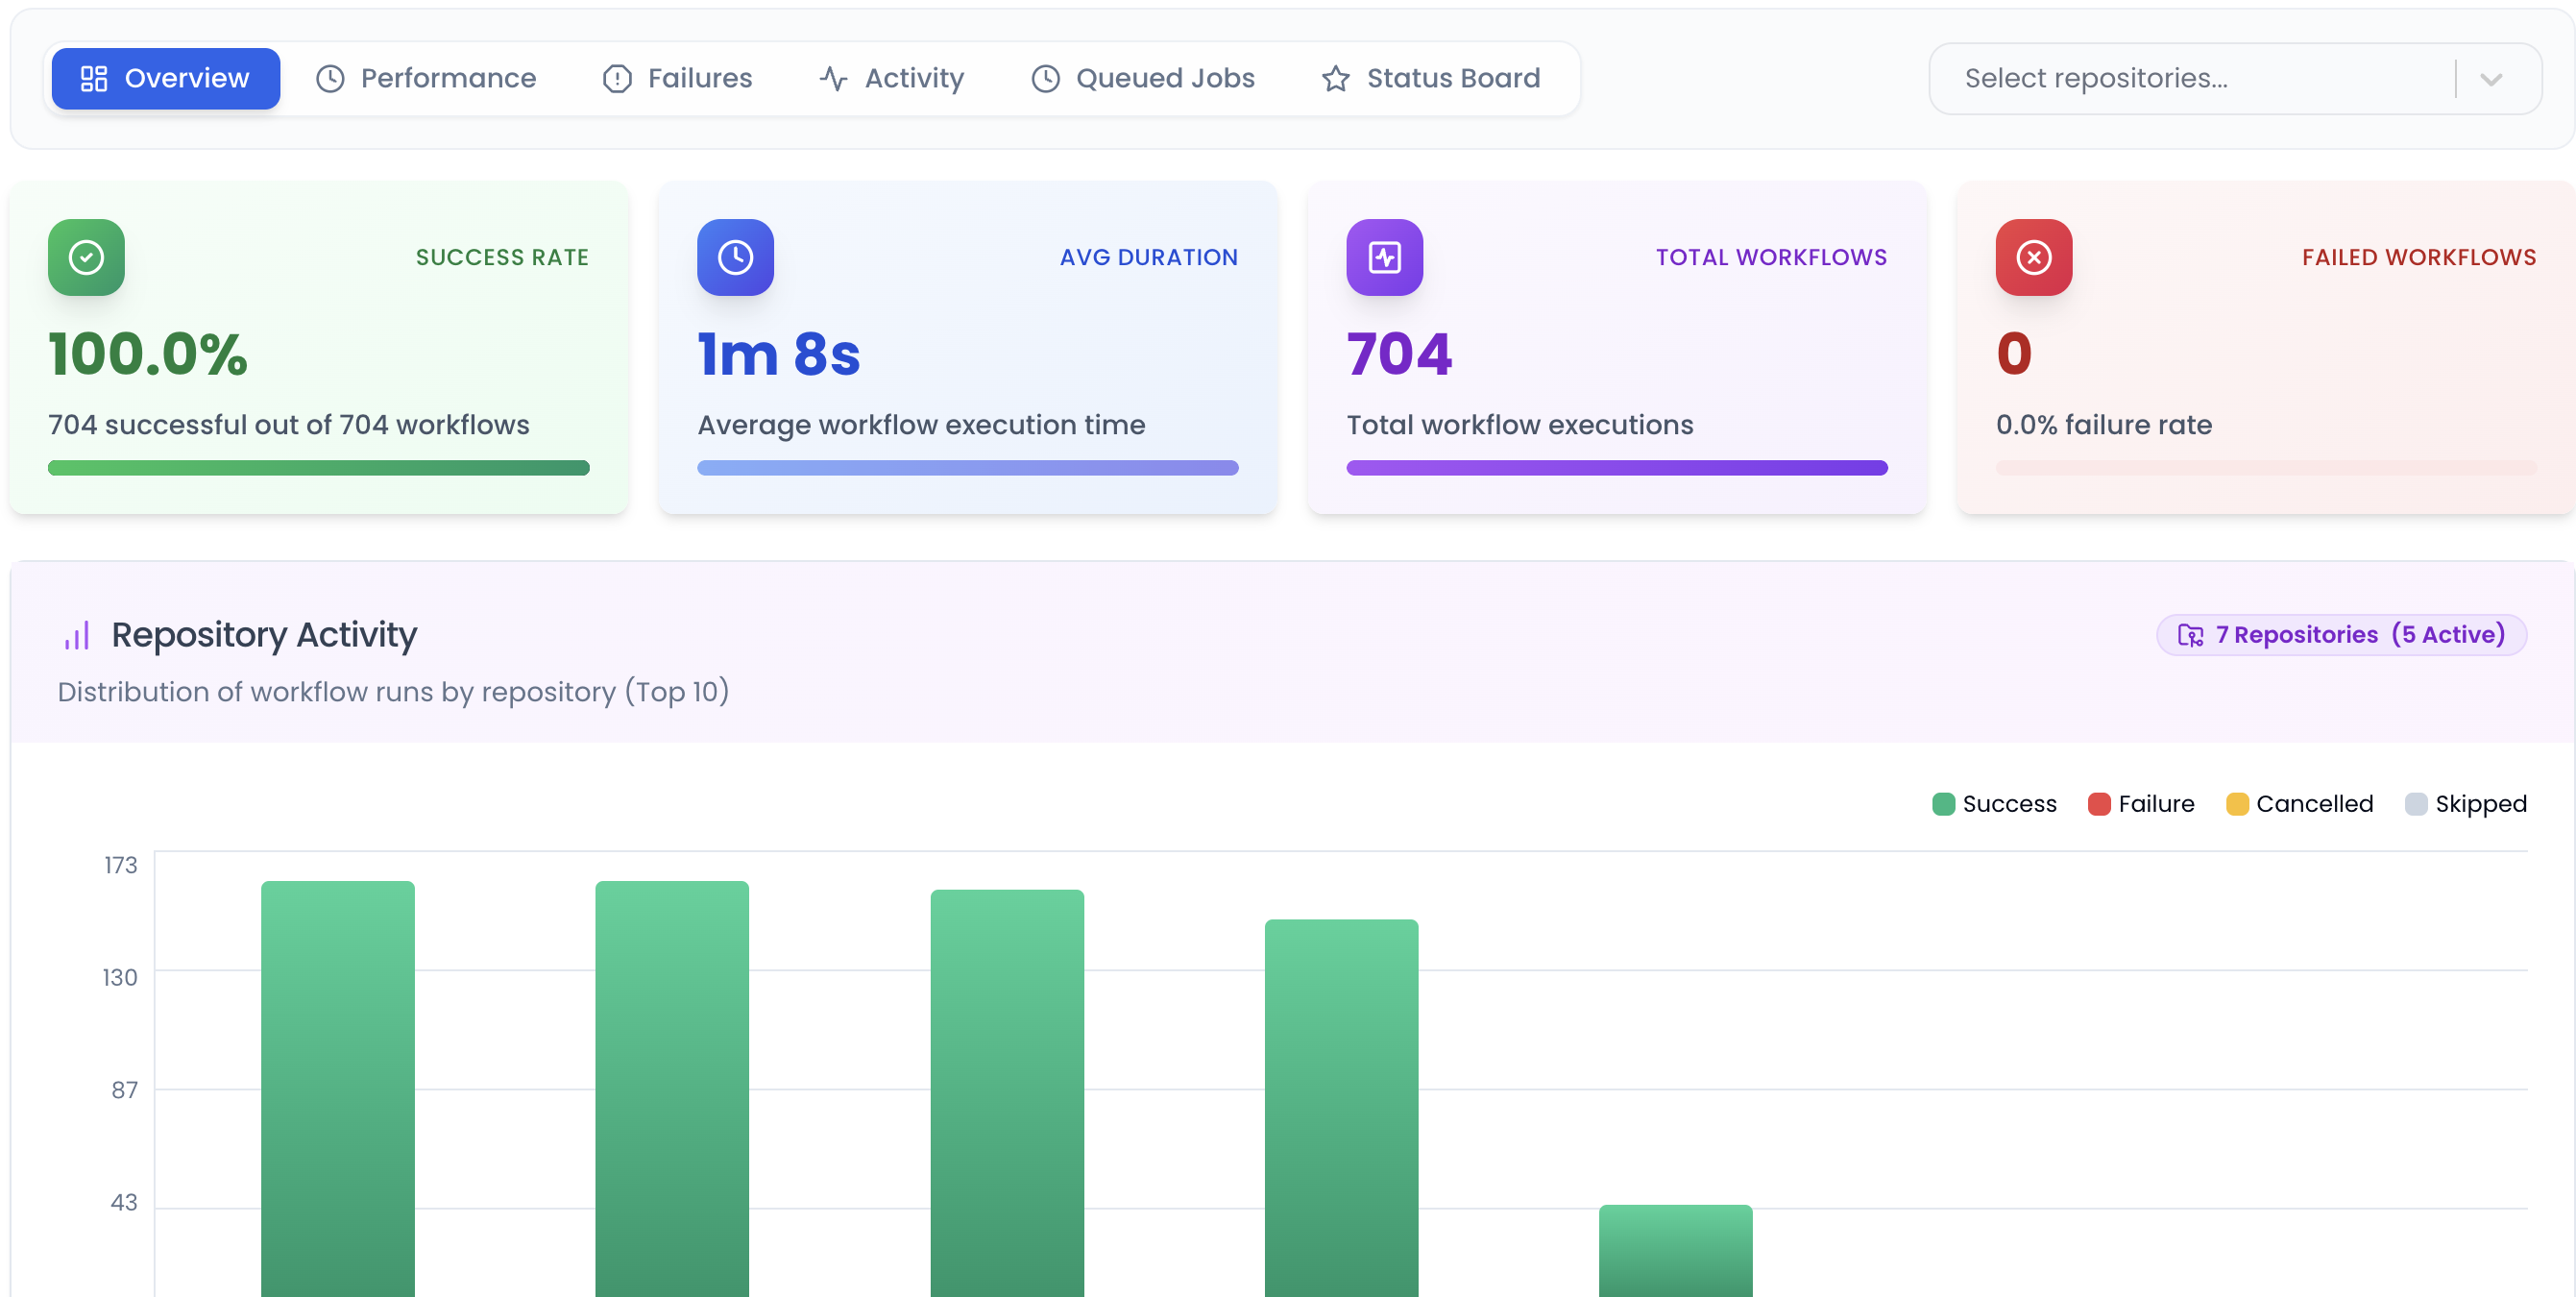
Key Stats & Analysis
Success rates, execution times, and activity distribution by days/hours
Runner Distribution
Usage tracking across UBUNTU, WINDOWS, MACOS and SELF HOSTED
Failure Analysis
Identify patterns in failures and problematic repositories
Status Board
Customizable status board of your important workflows
Organization-Level Insights
Monitor your entire GitHub Actions ecosystem from a single, comprehensive dashboard. Get actionable insights into performance, costs, and optimization opportunities.
Success Rate Analytics
Track workflow success rates across all repositories with detailed breakdowns by time periods and repository performance.
Activity Patterns
Understand when your team is most active with detailed activity distribution by days of the week and hours of the day.
Runner Usage Tracking
Monitor usage across all runner types: Ubuntu, Windows, macOS, and self-hosted runners with cost implications.
Failure Pattern Recognition
Identify recurring failure patterns, problematic repositories, and common failure points to improve overall reliability.